What Is Spindump Mac and How to Utilize It? [Complete Guide]
Mac has a debugging tool called Spindump that helps users troubleshoot issues with their Mac system. Spindump creates a snapshot of what the app was doing before it crashed, allowing users to understand the issue thoroughly and find its root cause. This guide will explain how to use Spindump and provide the precise steps to do so.
What Is a Spindump Mac?
The Spindump Mac tool is typically discovered while investigating high CPU usage tasks in Activity Monitor. This is because many users stumble upon it through this process. Spindump is a debugging tool that creates a snapshot, capturing details about the issue, which is generated as soon as an app crashes or becomes unresponsive, storing diagnostic logs in the system.
You can find log files at /Library/Logs/DiagnosticReports/ on your Mac, which also get sent to Apple for further analysis. The Spindump tool can be enabled from the Activity Monitor, and it may automatically start if an app behaves strangely or consumes excessive system resources.
The Spindump tool is used by developers and tech support to troubleshoot system and app issues, providing technical details that can be difficult for non-technical users to understand.
While using Spindump on a Mac is completely safe and doesn't harm the system, it's a tool that can provide detailed information about disk usage and can be useful for troubleshooting purposes.
How to Create/Turn Off Spindump on Mac?
If you're experiencing issues with a specific app on your Mac, you can use the Spindump tool to generate a detailed report about the problem when it occurs. To create a Spindump, simply follow the steps outlined in this section, which provide a straightforward guide to capturing the necessary information and identifying the root cause of the issue.
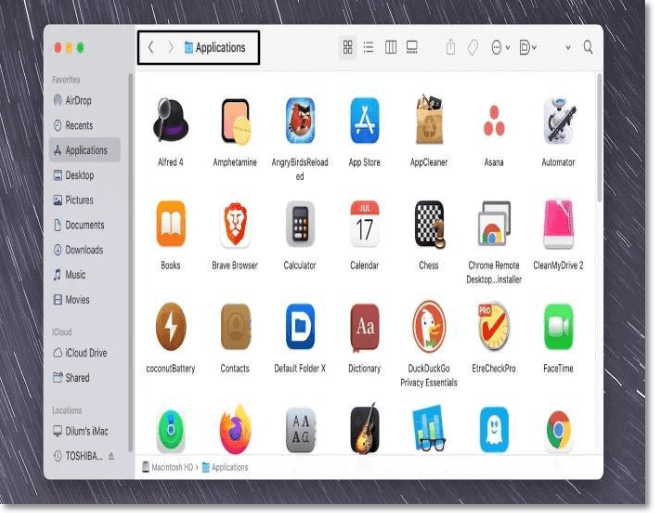
Step 1. To start, open the Finder and then navigate to the Applications section, where you can find the installed software on your Mac.

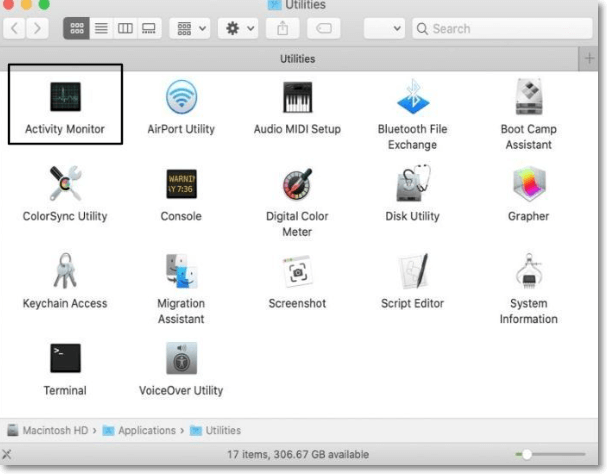
Step 2. To access the Activity Monitor, go to the Applications section and then move to the Utilities section, where you can find and open the Activity Monitor.

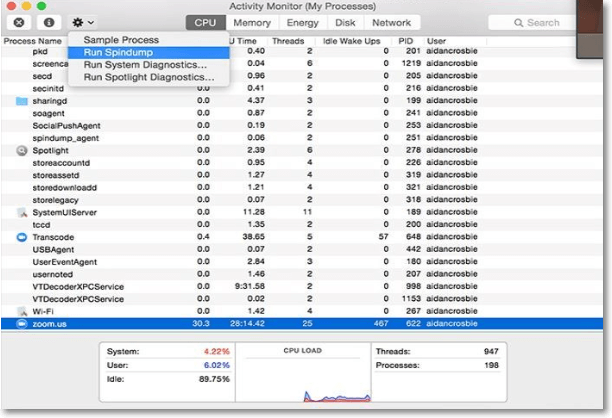
Step 3. Now, select a particular app or task with which you're currently facing the issues. For instance, if you're facing crash issues with an app, look for it in the Activity Monitor and select it.
Step 4. Once the app is selected, click on "View" in the top menu and select "Run Spindump" from the dropdown menu to run the Spindump tool.

Spindump Mac will now start monitoring the selected app and its behavior. It will take a snapshot and share information about what the app was doing at the time of its crash.
To avoid wasting system resources, it's recommended to disable Spindump after taking a snapshot, as running it continuously can be very resource-intensive.
Here are the steps to disable the Spindump Mac tool:
Step 1. To enter Recovery Mode, restart the Mac and press the Command + R key combination as soon as the reboot process starts.
Step 2. To open the Terminal, go to the Launchpad on your Mac, search for the Terminal utility, and click on it to open it.

Step 3. Once opened, execute the following command in the console:
csrutil disable

Step 4. Enter the following command in the Terminal app:
sudo launchctl unload -w /System/Library/LaunchDaemons/com.apple.spindump.plist

Step 5. To re-enable System Integrity Protection, enter your Mac password and execute the command `csrutil enable` in the Terminal app.
sudo mv /System/Library/LaunchDaemons/com.apple.spindump.plist /System/Library/LaunchDaemons/com.apple.spindump.plist.bak
You removed the Spindump from the running processes list, which should improve your Mac's performance and make it run faster. This change should also be reflected in the Activity Monitor, allowing you to see a more accurate representation of your system's activity.
Final Words
The Spindump tool is a useful debugging tool for Mac users, helping to troubleshoot issues with ease. It can be enabled and disabled as needed, and the steps to do so are mentioned above. By using Spindump, users can resolve problems with their Mac, and it's a valuable resource for Mac troubleshooting.
Related Articles
- What Is Wifi Card and How to Use It? [Everything You Need to Know]
- [3 Ways] How to Uninstall Apps on Windows 11
- [Bad Sector Explained in 2022] What Is Bad Sector?
- How to Change Font Size on Windows 11/10/8/7? [Full Guide 2022]